Some Statistics Regarding Roadside Inspections
Understanding Roadside Inspections
Most drivers dread having to deal with a roadside inspection. That dread is well founded when you consider that the drivers career is on the line every time he faces off with a DOT inspector who is just doing his or her job. Being able to anticipate what inspectors are focusing on can be a great help.
We recently found a web page that contains interactive tools that can really give the driver an edge. It contains statistics regarding roadside inspections that are searchable by state, violation type, vehicle weight, fleet size and much more. For instance, if you are going to be driving in Arkansas, you can do some quick research to see how many inspections are being conducted and what kind of violations are being cited.
FYI, Arkansas was picked totally at random, we are not picking on them.
Roadside Inspection Activity
The chart below shows that in 2020 in Arkansas there were very few Federal Inspections, but State enforcement officials were very active. About 25% of inspections are full inspections, so best to make sure my logs and inspection records, as well as my vehicle, are in tip top shape.
It also looks like the Federal inspectors were a little more stringent with drivers than local enforcement, but local enforcement was much more stringent regading vehicle infractions.
Driver Violations
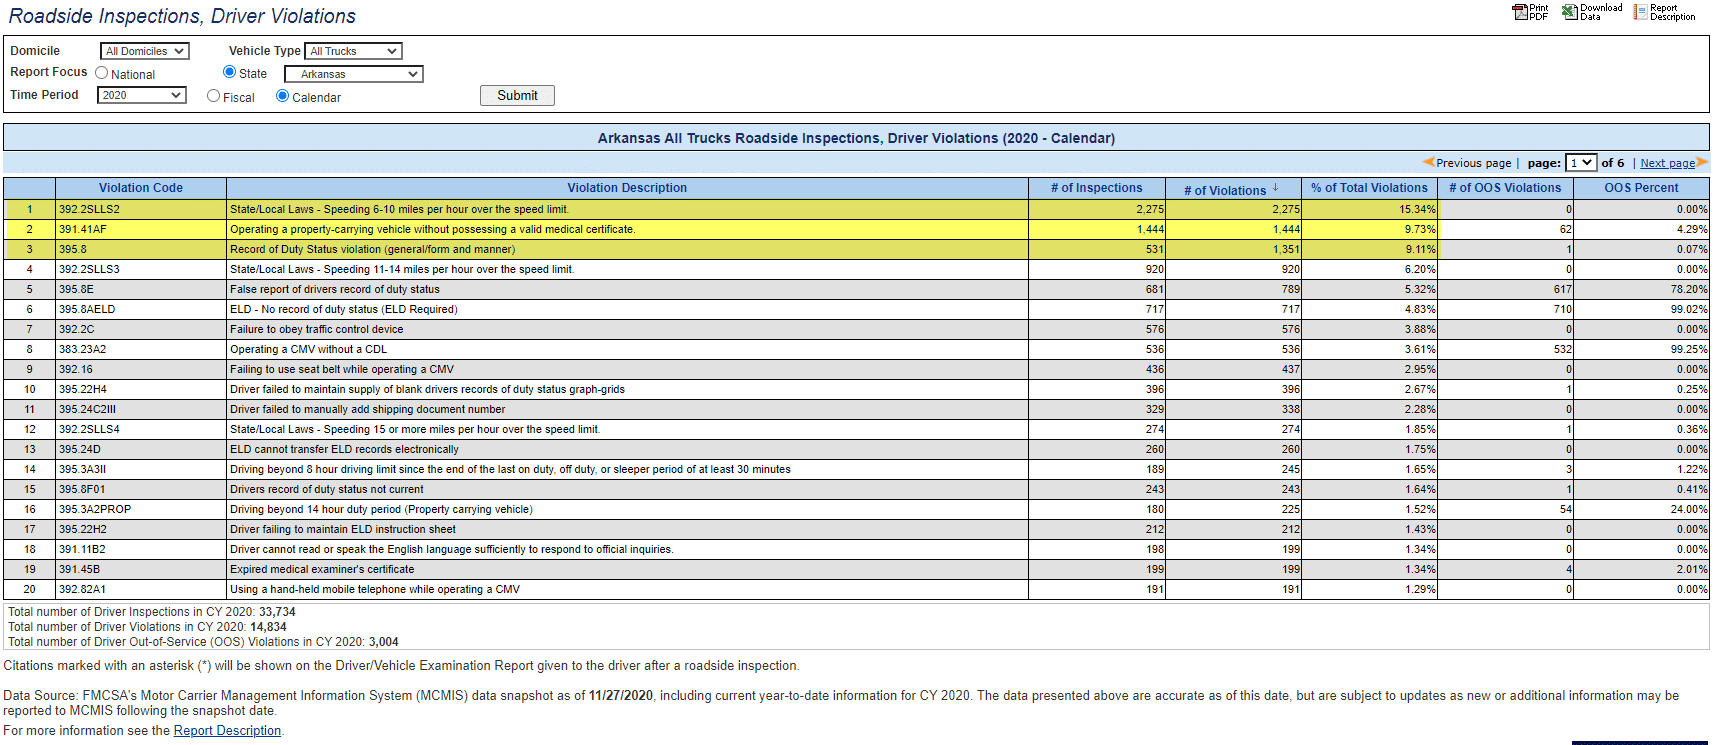
Looking at the top 3 driver violations cited, it would seem that most violators were pulled over for a relatively minor speeding infraction of 6-10 mph over the speed limit. Common sense tells us that obeying the speed limit while driving in Arkansas is its own reward.
Vehicle Violations
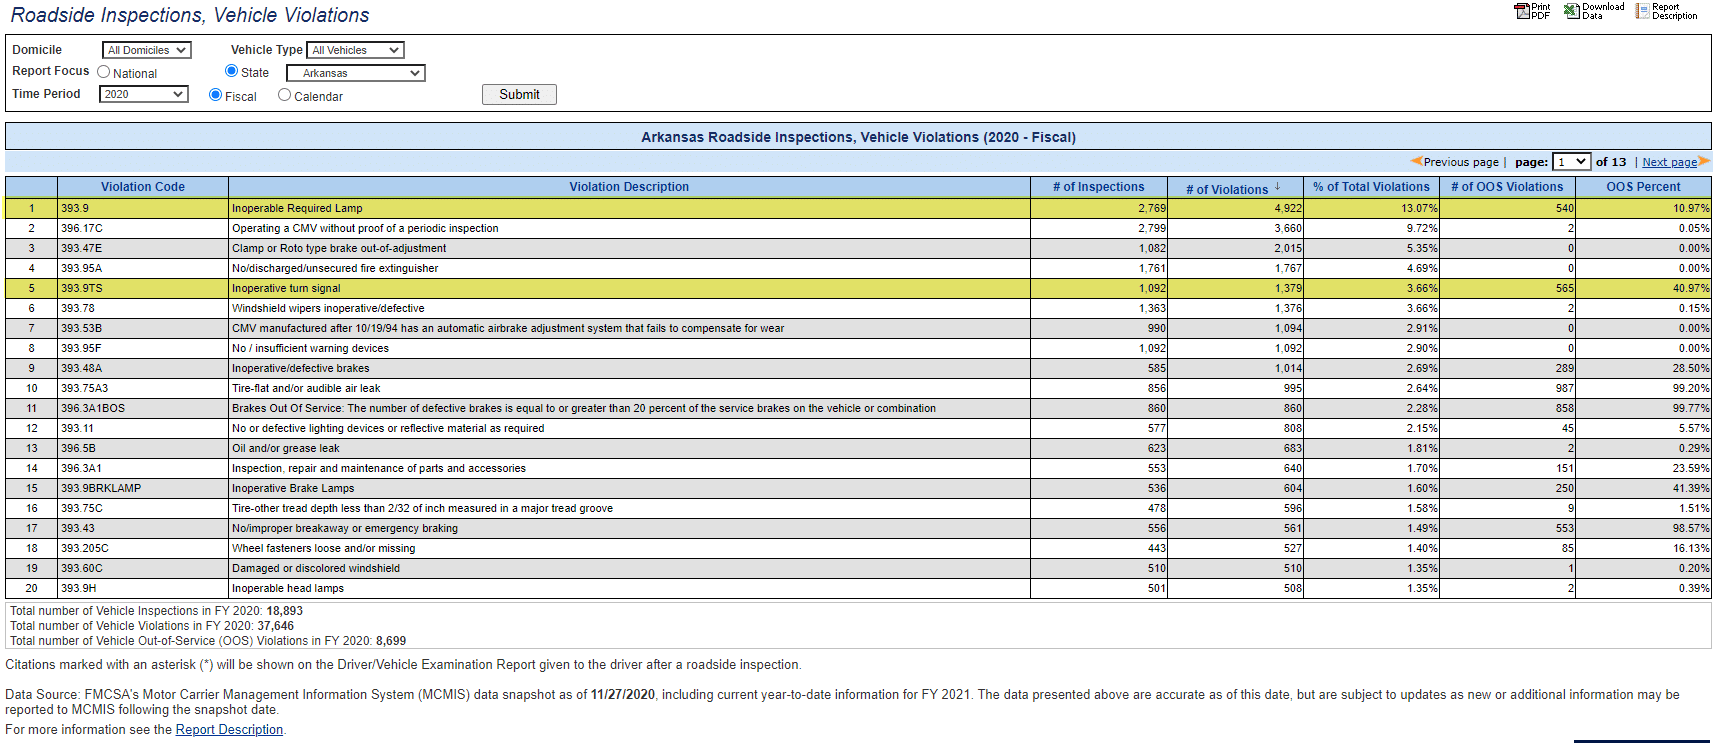
Now that you have been pulled over for driving 7 mph over the posted speed, you can bet the inspector is going to check all of your lights and not miss a thing. Inoperative turn signals and lights will have you taken out of service in Arkansas.
Monthly Trends in Roadside Inspections
Understanding the roadside inspection trends by month can also be very interesting. From the chart below we speculate that after the initial COVID 19 shutdowns either enforcement was staying home or drivers were. It would be interesting to dig deeper to see if this is actually a seasonal trend based on some other factor.
Information is Power
Understanding the trends based on the factors discussed is certainly interesting and give drivers an edge, BUT nothing takes the place of constant vigilance when it comes to vehicle and driver safety. Our goal is for every driver to arrive home safely after every trip. No exceptions!


