Some Statistics Regarding Roadside Inspections

Understanding Roadside Inspections

Most drivers dread having to deal with a roadside inspection. That dread is well founded when you consider that the drivers career is on the line every time he faces off with a DOT inspector who is just doing his or her job. Being able to anticipate what inspectors are focusing on can be a great help.

We recently found a web page that contains interactive tools that can really give the driver an edge. It contains statistics regarding roadside inspections that are searchable by state, violation type, vehicle weight, fleet size and much more. For instance, if you are going to be driving in Arkansas, you can do some quick research to see how many inspections are being conducted and what kind of violations are being cited.

FYI, Arkansas was picked totally at random, we are not picking on them.

Roadside Inspection Activity

The chart below shows that in 2020 in Arkansas there were very few Federal Inspections, but State enforcement officials were very active. About 25% of inspections are full inspections, so best to make sure my logs and inspection records, as well as my vehicle, are in tip top shape.

It also looks like the Federal inspectors were a little more stringent with drivers than local enforcement, but local enforcement was much more stringent regading vehicle infractions.

Roadside Inspection Activity AR

Driver Violations

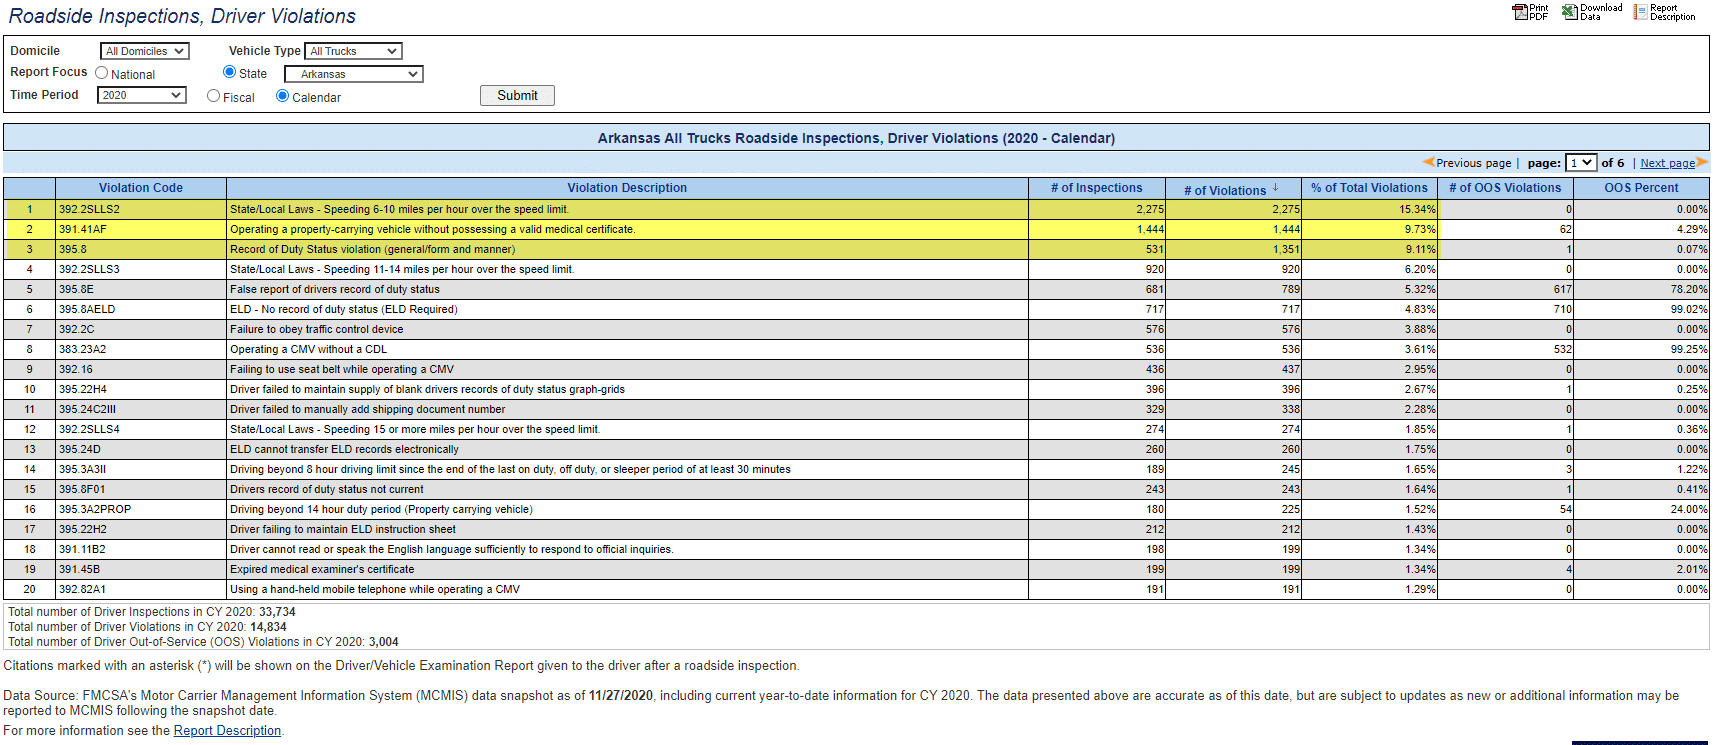
Looking at the top 3 driver violations cited, it would seem that most violators were pulled over for a relatively minor speeding infraction of 6-10 mph over the speed limit. Common sense tells us that obeying the speed limit while driving in Arkansas is its own reward.

Driver Violations AR

Vehicle Violations

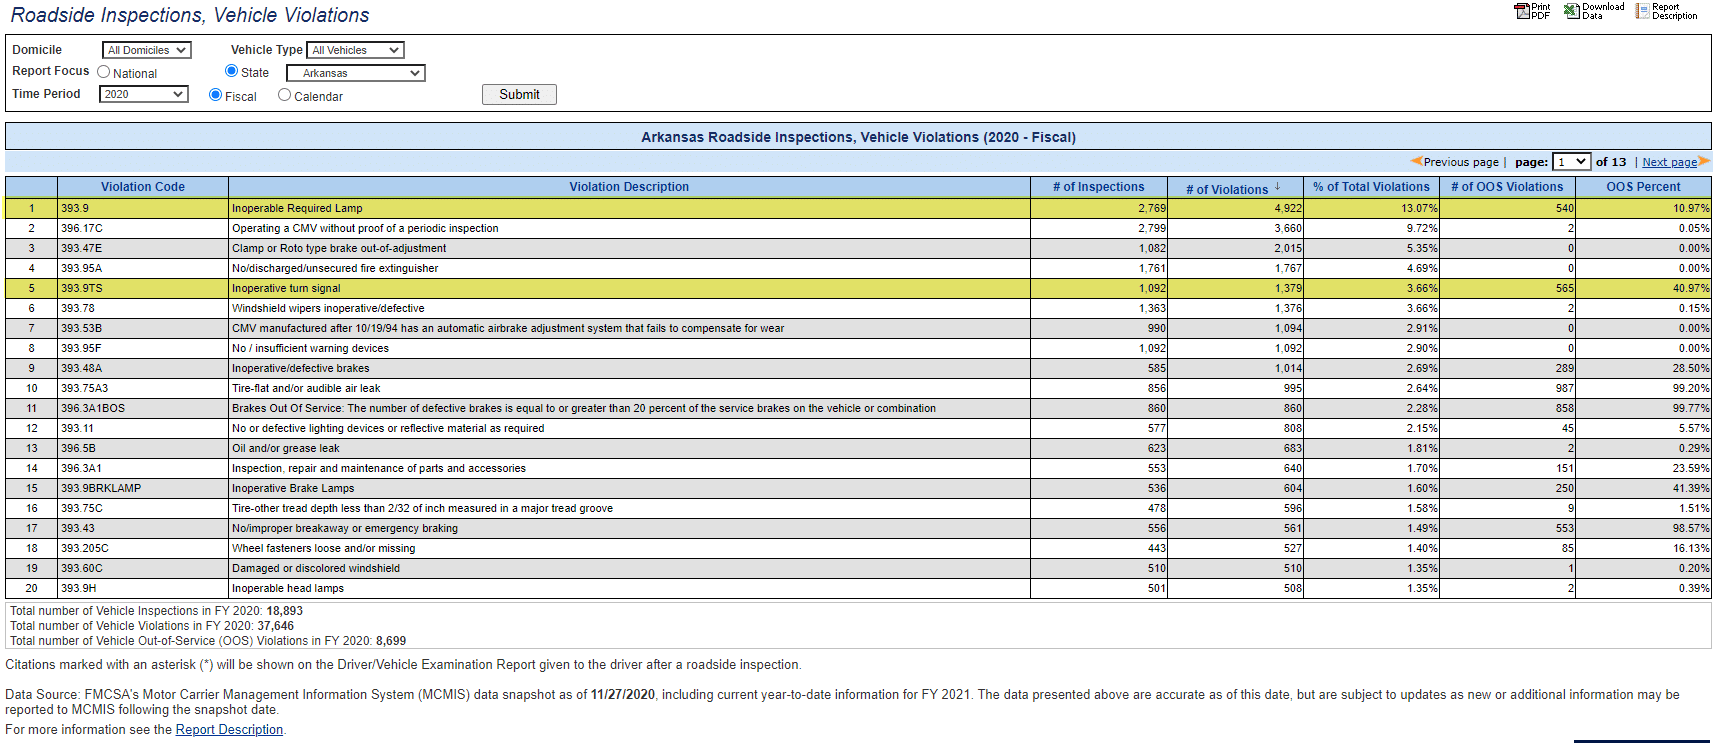
Now that you have been pulled over for driving 7 mph over the posted speed, you can bet the inspector is going to check all of your lights and not miss a thing. Inoperative turn signals and lights will have you taken out of service in Arkansas.

Vehicle Violations in AR

Monthly Trends in Roadside Inspections

Understanding the roadside inspection trends by month can also be very interesting. From the chart below we speculate that after the initial COVID 19 shutdowns either enforcement was staying home or drivers were. It would be interesting to dig deeper to see if this is actually a seasonal trend based on some other factor.

Roadside Inspections by month in AR

Information is Power

Understanding the trends based on the factors discussed is certainly interesting and give drivers an edge, BUT nothing takes the place of constant vigilance when it comes to vehicle and driver safety. Our goal is for every driver to arrive home safely after every trip. No exceptions!

GEotab GO9 GPS Vehicle Tracking
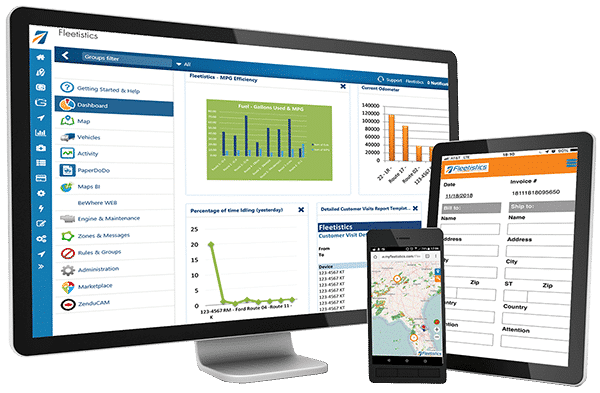
Fleet Management Platform
Mobile Phone GPS Tracking App
Rugged Laptop 3

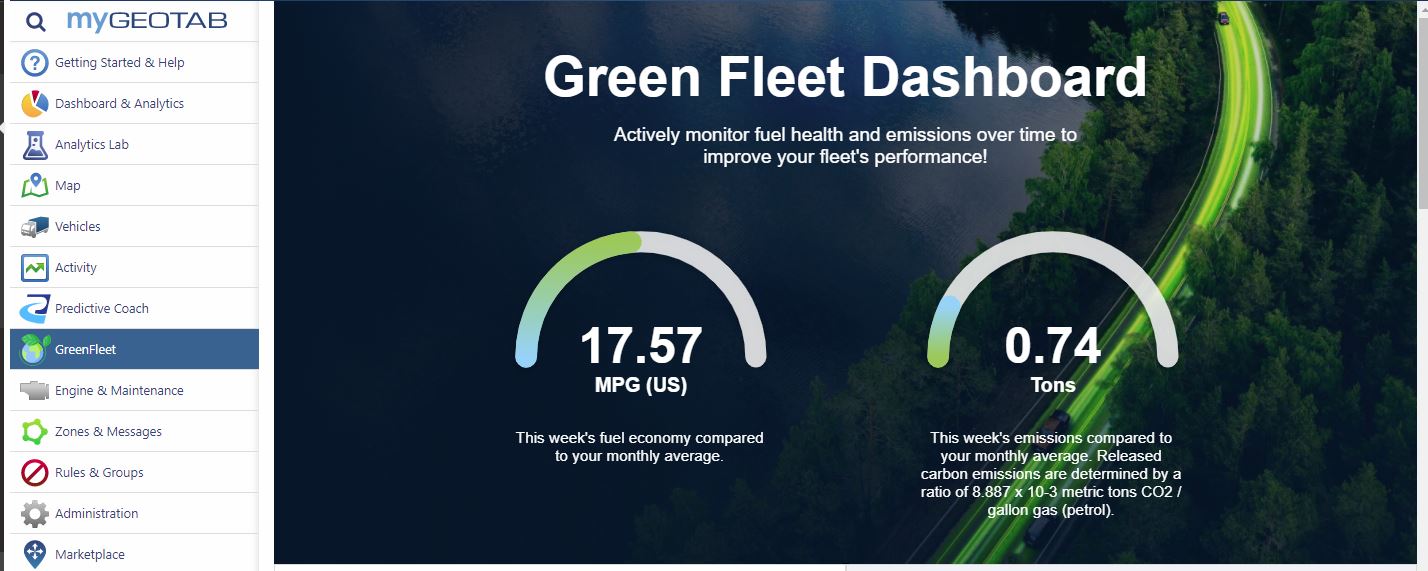
Green Fleet Dashboard to Visualize Your Changing Environmental Impact

Green Fleet Dashboard – Free Marketplace Add In

The Green Fleet Dashboard is one of Geotab’s latest innovations. It is a free add in available from the Geotab Marketplace. Have you seen it yet?

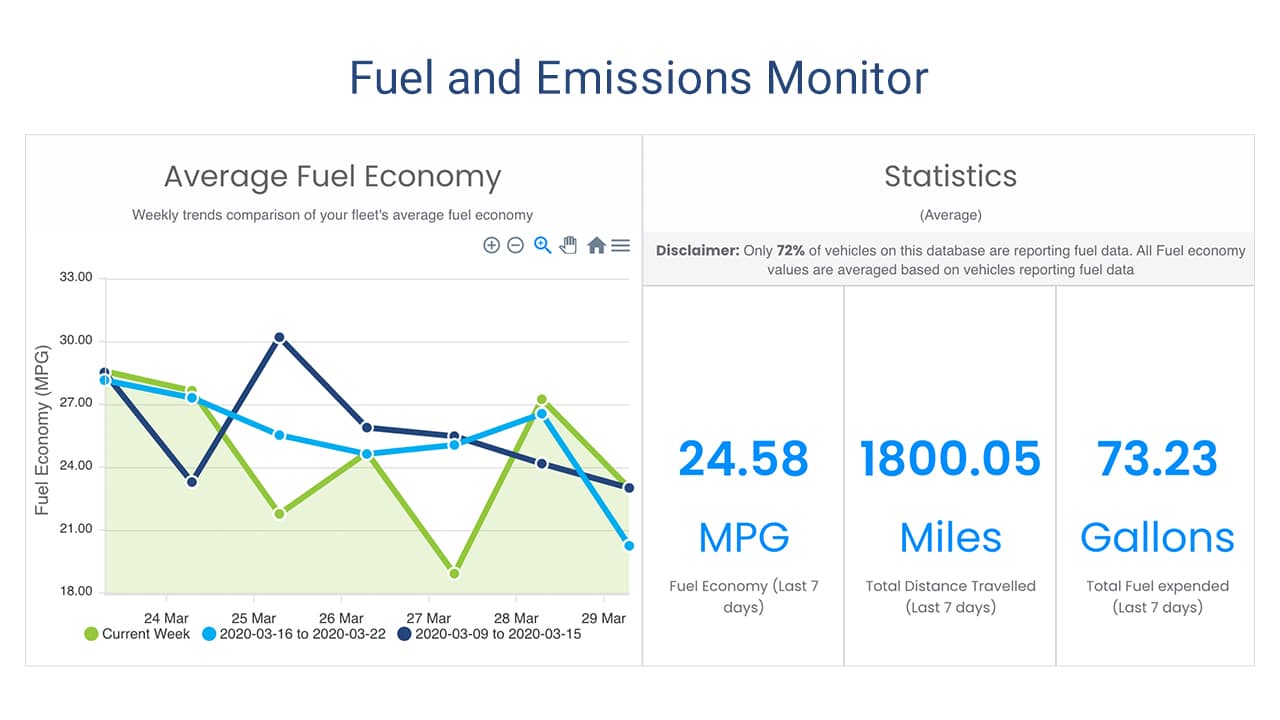
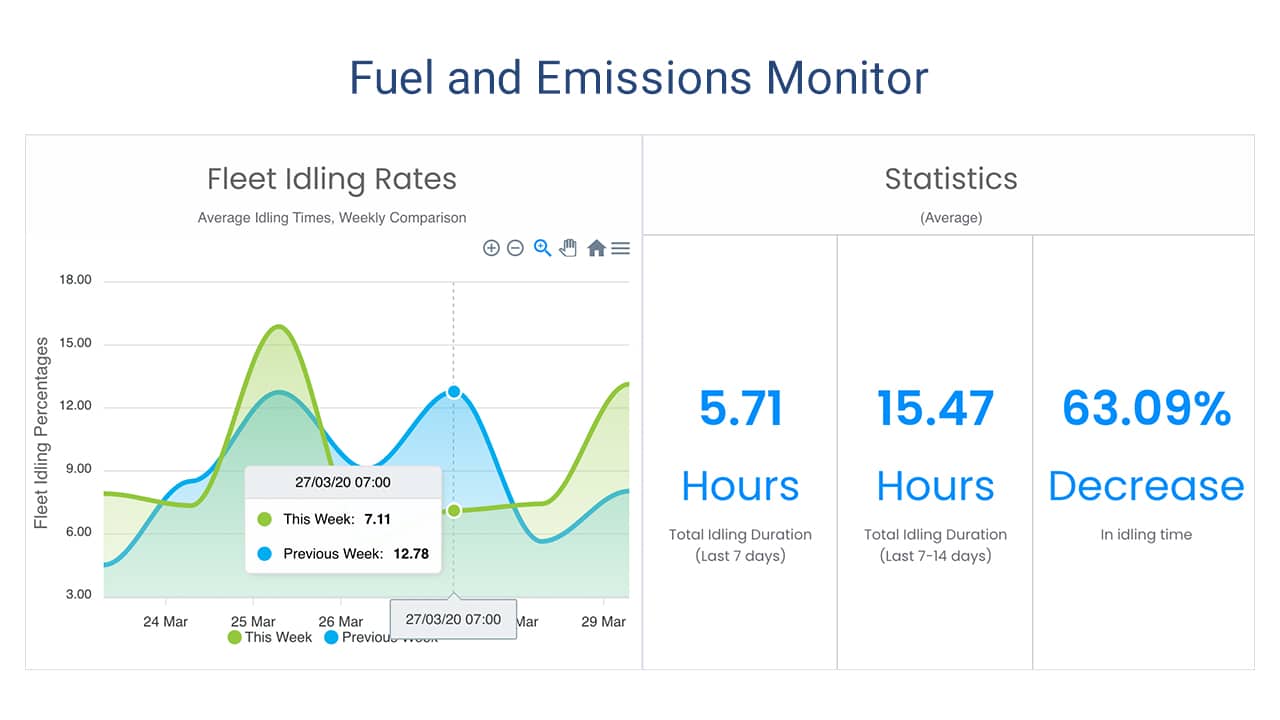
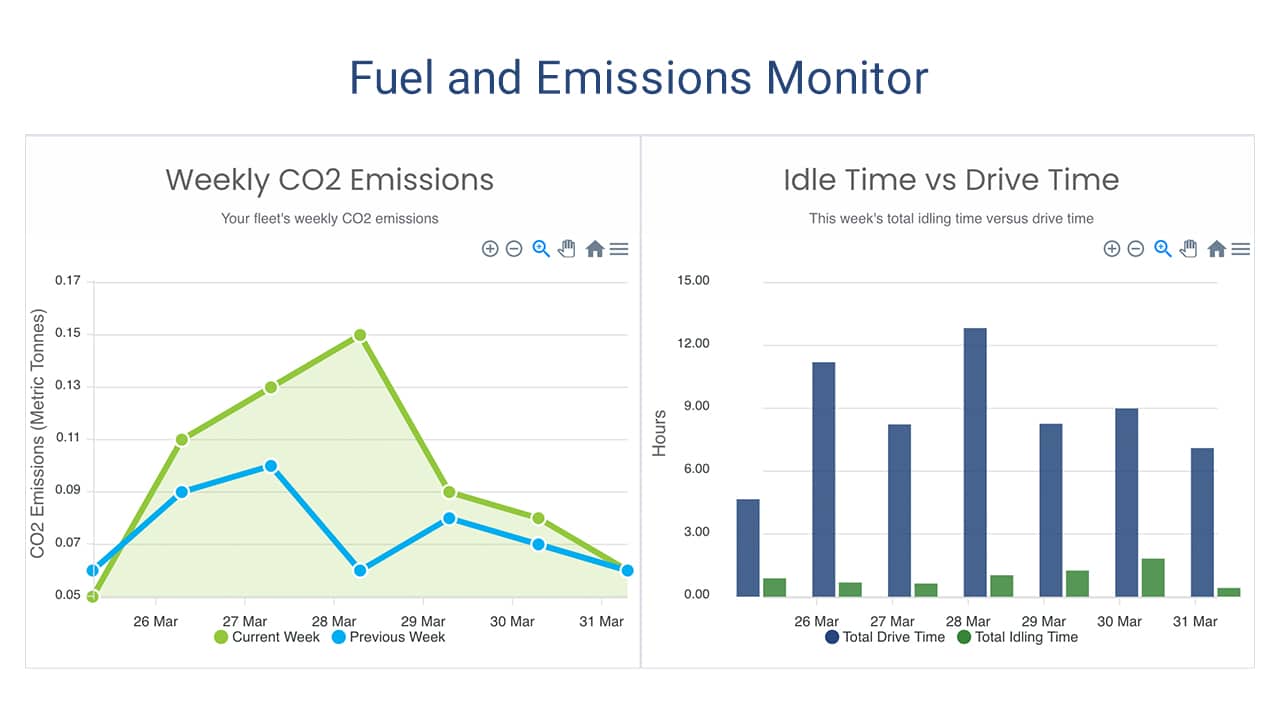
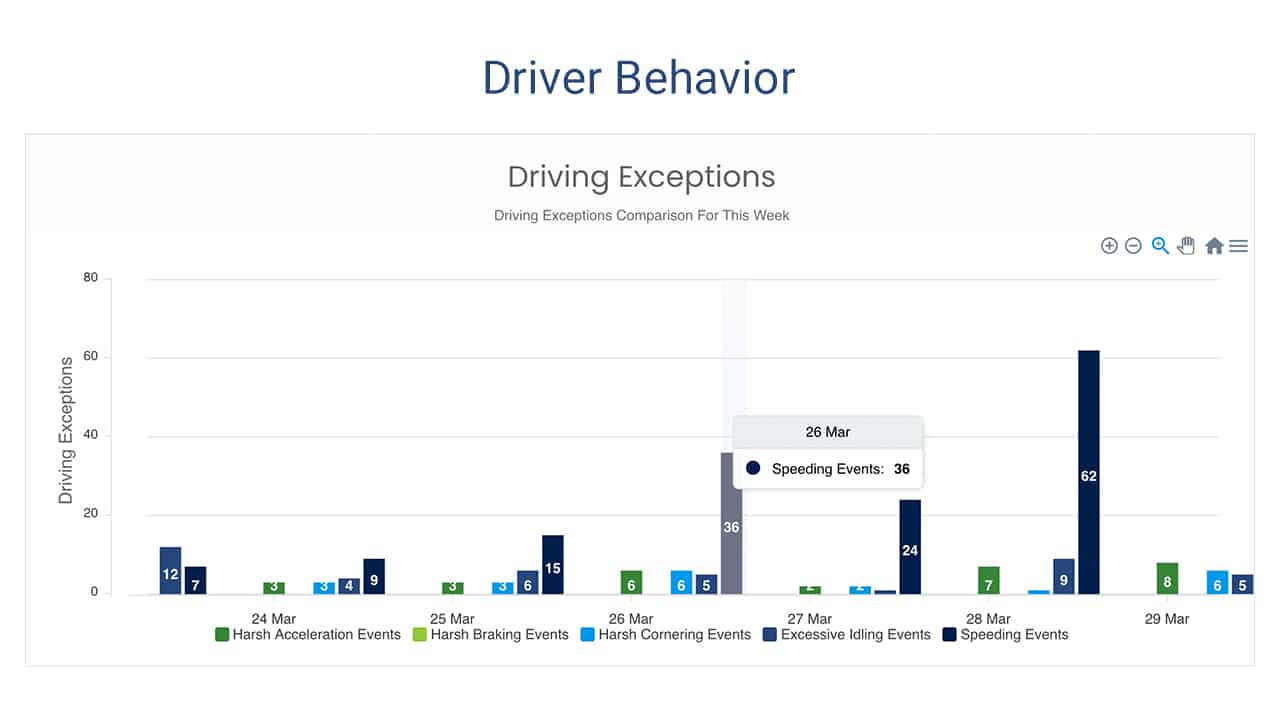
This add in displays a fleet’s efforts to reduce their environmental impact. It helps fleet managers to visualize their progress with improving fuel economy and reducing emissions. The dashboard provides key metrics on fuel useage and driving behaviors, that provide quick insight into how well your fleet is performing, and flags opportunities for improvement.

Green Fleet Dashboard

Green Fleet Dashboard Features

  • Monitor your fleet’s monthly and yearly average fuel economy
  • Track monthly and yearly emissions
  • Track key performance indicators related to fuel efficient driver behavior, including:
    • idling time
    • speed
    • harsh acceleration and braking
  • Highlight best and worst performers
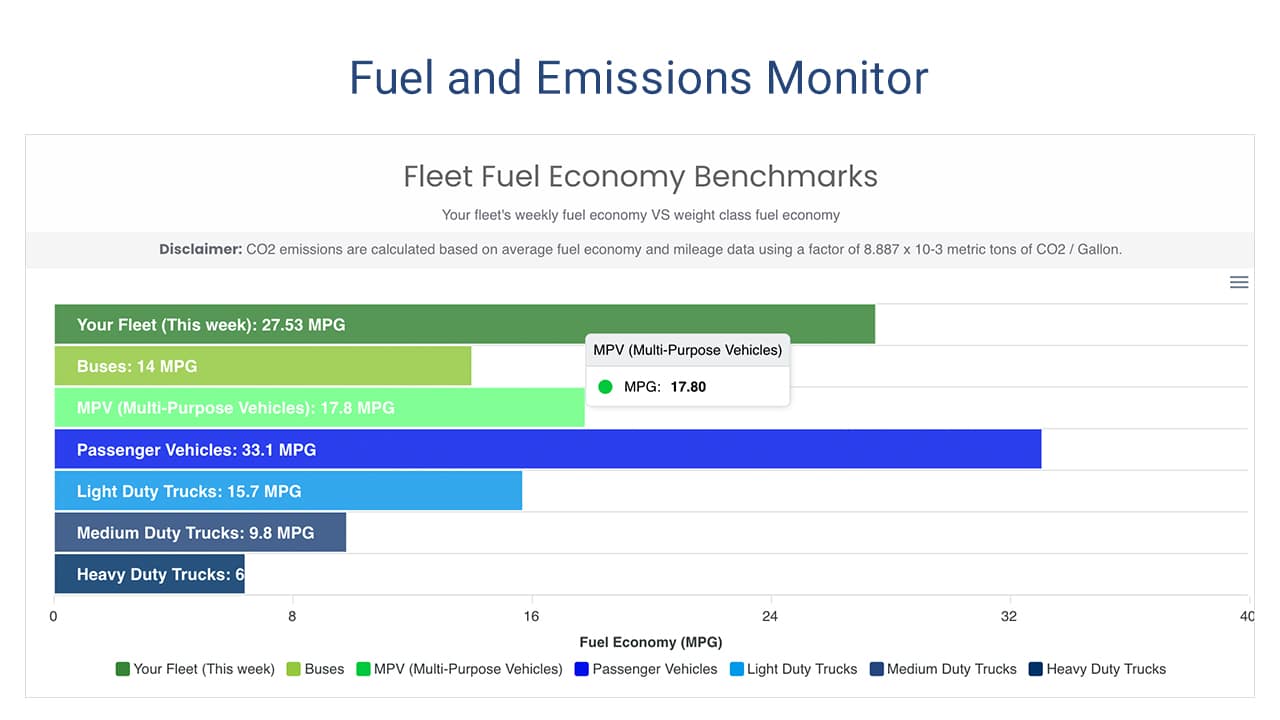
  • Compare your fleet’s performance with fleet industry benchmarks

The Green Fleet Dashboard add in provides you with exceptional visual information. The graphics are easy to digest and keep you focused on achieving your green fleet goals. What a great tool to stay focused on reducing your environmental impact!

Below are some examples of the charts and graphs the Green Fleet Dashboard delivers.

Installing the Green Fleet Dashboard

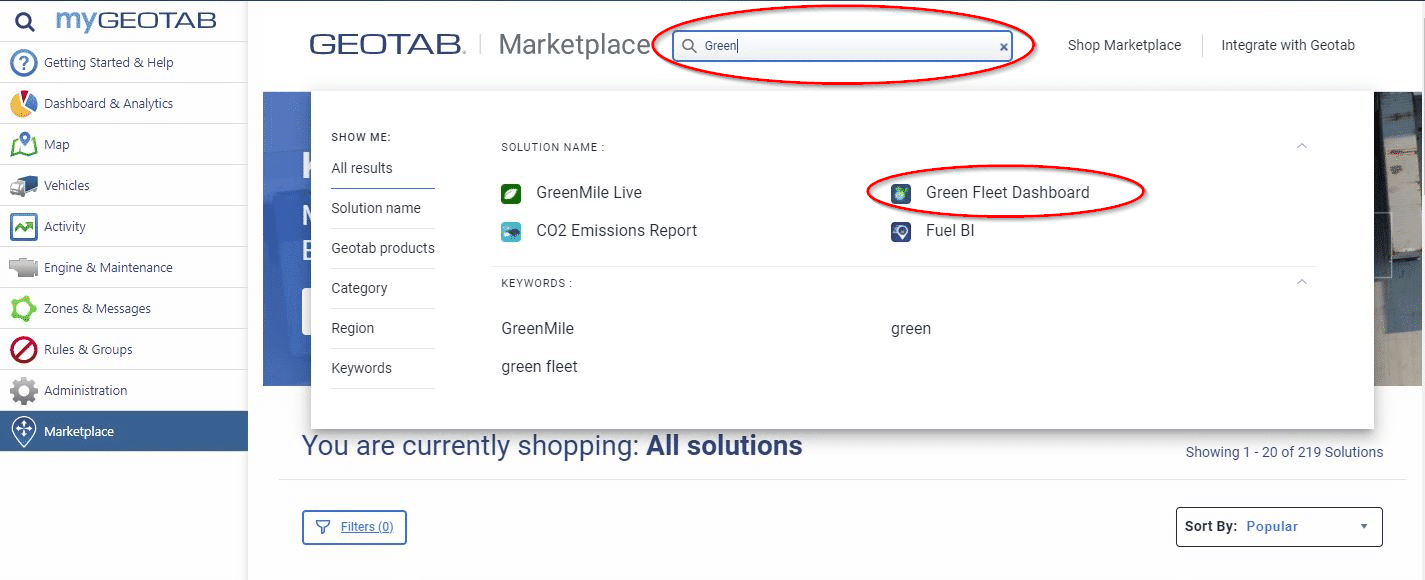
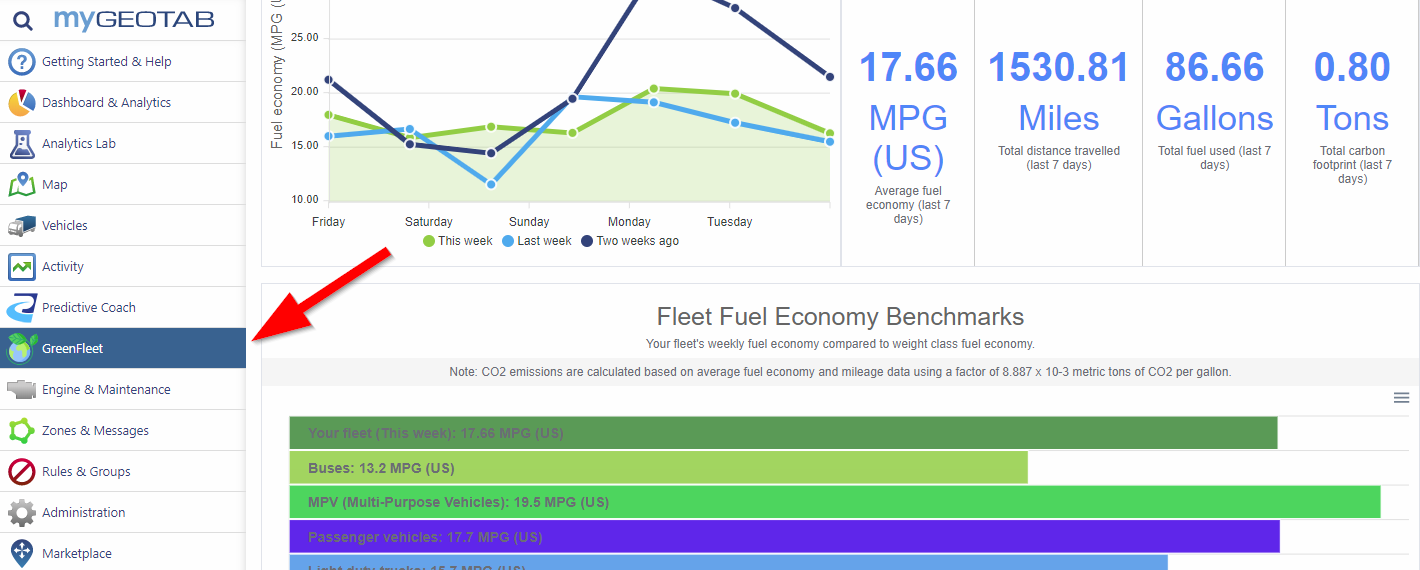
To install the add in, simply log into your Geotab account and select “Marketplace” at the bottom of the main menu. Once in the Marketplace, begin typing “green fleet” into the search bar until you see the Add In listed. Click on the add in logo, then click install on the next page. Once installed, you will see the new dashboard in your Geotab menu. Easy as 1-2-3!

Just click to expand the images below.

1

Search Geotab's Marketplace

2

Install Now

3

Green Fleet Dashboard Installed
GEotab GO9 GPS Vehicle Tracking
Fleet Management Platform
Mobile Phone GPS Tracking App
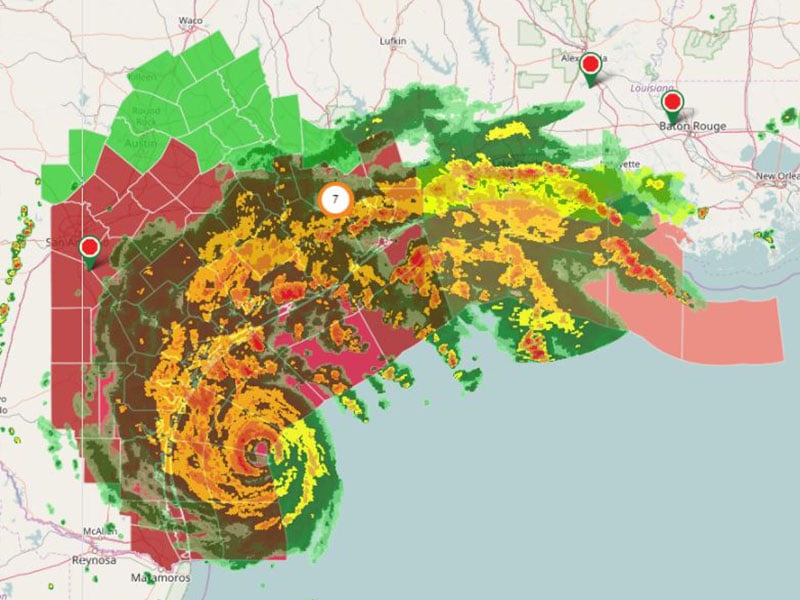
Fleet Weather Service

What’s New In MyFleetistics Analytics

Have you clicked on MyFleetistics Analytics lately?

New Safety Dashboard

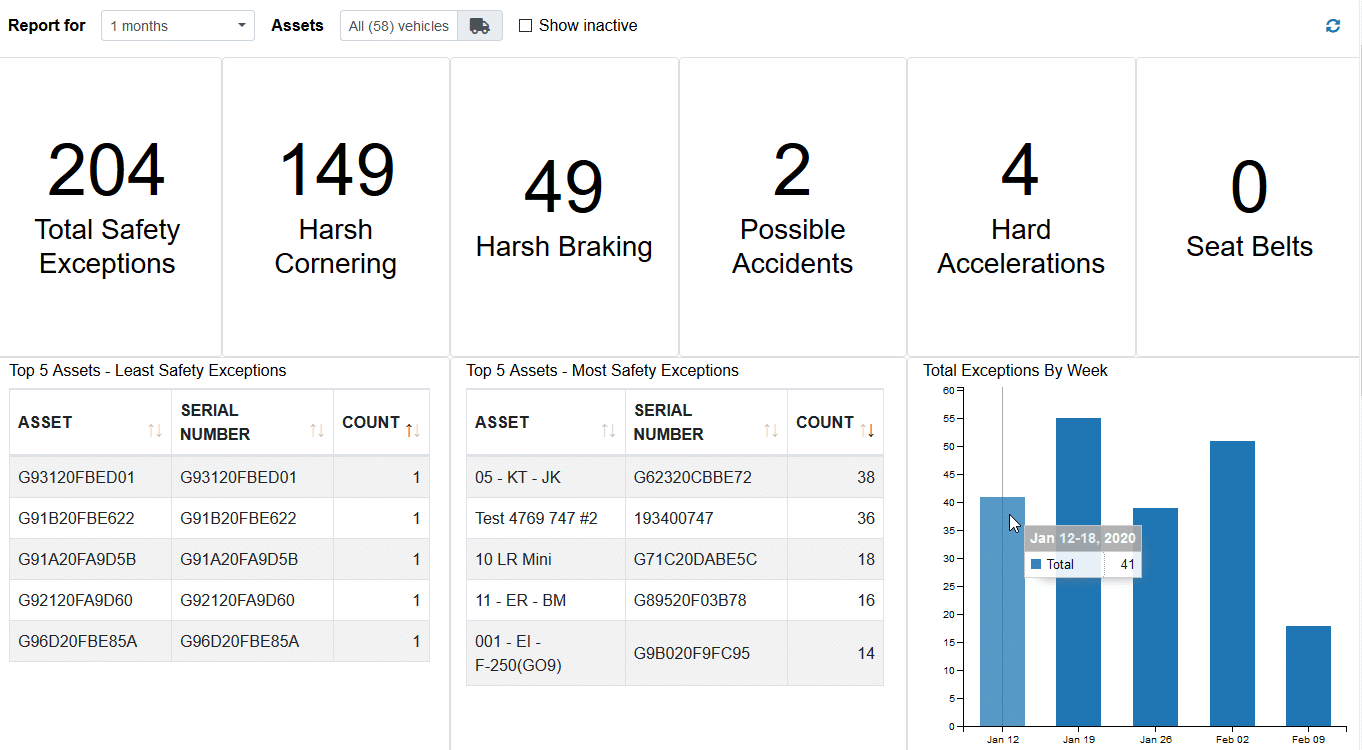
Fleetistics is always working hard to improve the toolset we provide our clients in the MyFleetistics portal. Going beyond GPS tracking for fleet vehicles, MyFleetistics Analytics brings a variety of tools and views to the data our GPS tracking devices collect. One of our most recent additions is the Safety Dashboard under MyFleetistics Analytics. Driver Safety data is crucial to Fleet Managers. Accessing it quickly in an easy to use format saves you time and money. The Fleetistics Safety Dashboard provides users the most important information without the normal steps required in the GPS system.

Initially, managers can motivate drivers to improve safety by posting this information where drivers congregate in the workplace. Ultimately they can set goals and track the improvement together. We like to say, “Manage by exception and recognize by performance”.
There are several design elements used to make this dashboard pop with “at a glance” information. First, the top row displays the total number of safety exceptions in very large print. Next, there is a breakdown of the 5 performance indicators that are included in that total. Below are charts. First, we display the 5 assets with the fewest safety exceptions (5 safest drivers). Next, a chart shows the 5 assets with the most safety exceptions (5 most at-risk drivers). Finally, there is a graph of total exceptions by week. As a result, you can easily see if both positive and negative trends. One quick look at the dashboard answers three very important questions.

  1. Who gets a pat on the back?
  2. Who needs to have that safety chat?
  3. What driving behaviors should be discussed in reviews and driver meetings?

MyFleetistics Analytics Safety Dashboard

Odometer, Exceptions, Device Status With One Click

MyFleetistics Analytics reports are designed to filter through the data and display what you need to know in a clean and simple visual format. Additionally, reports are searchable and sortable to help you easily identify the issues you need to look into. Your GPS tracking system then provides the reports and tracking details needed to support the conclusions you come to and the decisions you make.

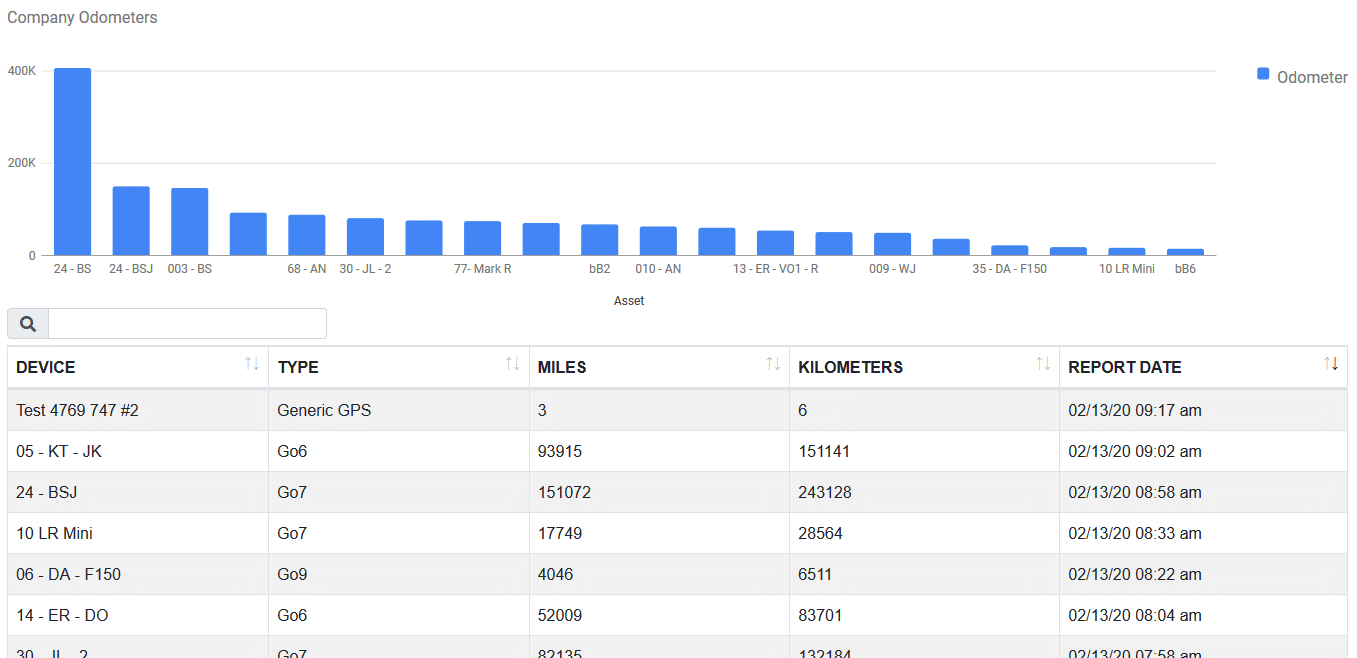
Odometer Analytics

Simple odometer analytics help Fleet Managers to ensure vehicles are not underused or overused. Odometer readings are part of the data you will find in many fleet GPS tracking system reports, but it becomes more usable when isolated in a more meaningful format. The odometer graph makes it easy to see which vehicles are accumulating miles much faster than others. As a result, it is easy to identify where transferring the workload to other vehicles would be beneficial. Who wants to run out a new vehicle warranty faster than necessary? Likewise, it can expose vehicles that may be making unauthorized trips.

Exceptions

Above we looked at total exceptions on the safety dashboard. The exceptions dashboard drills deeper into the details that show which driver or vehicle is generating what exceptions. Managing individual driver behavior with training and incentives for improvement pays off. Even more, identifying and discussing weak areas increases safety awareness and lowers risk.

If you would like assistance accessing the many features in MyFleetistics, visit our training resources page or call us at 855.300.0527.