Usage Based Insurance, Powered by Telematics

What is Usage Based Insurance?

Usage Based Insurance, or UBI, is defined by the National Association of Insurance Commissioners as a type of auto insurance that tracks mileage and driving behaviors. They further explain that the basic idea of UBI is that a driver’s behavior is monitored directly while the person drives, allowing insurers to more closely align driving behaviors with premium rates.

How UBI Works

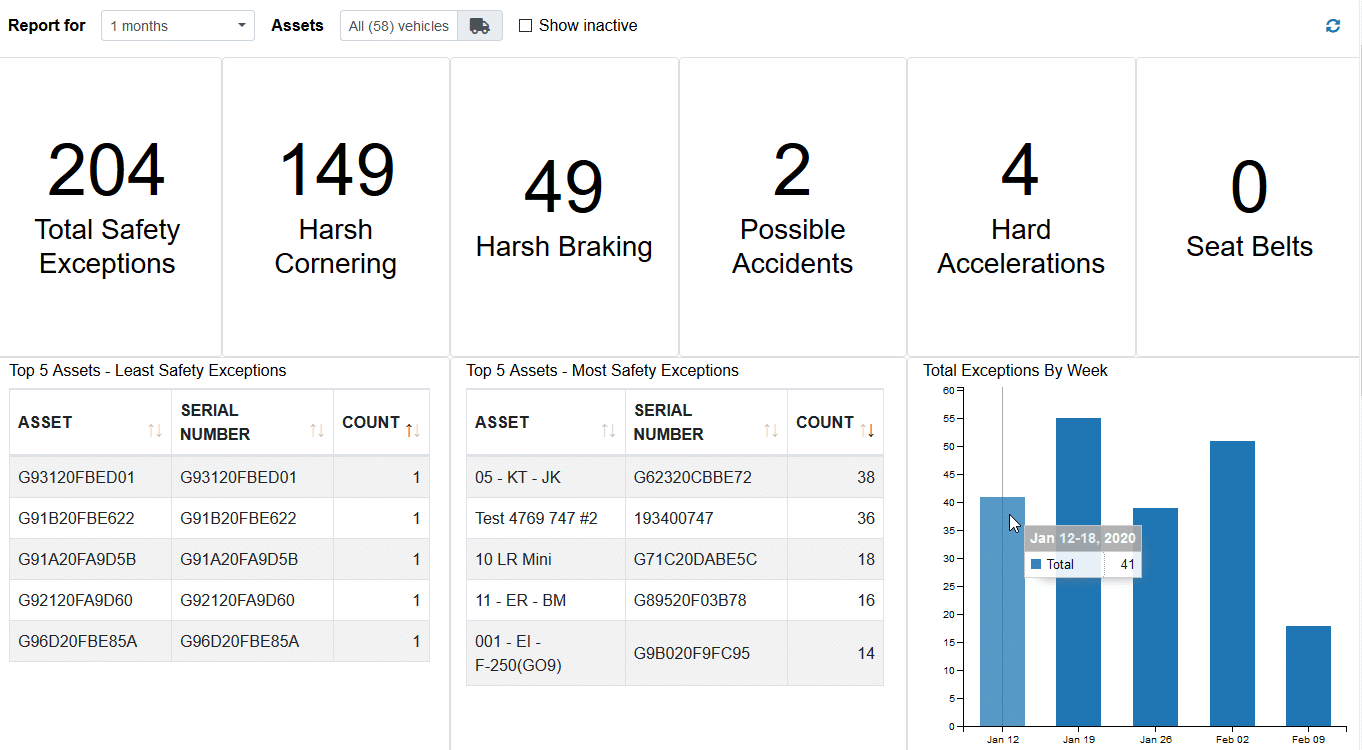
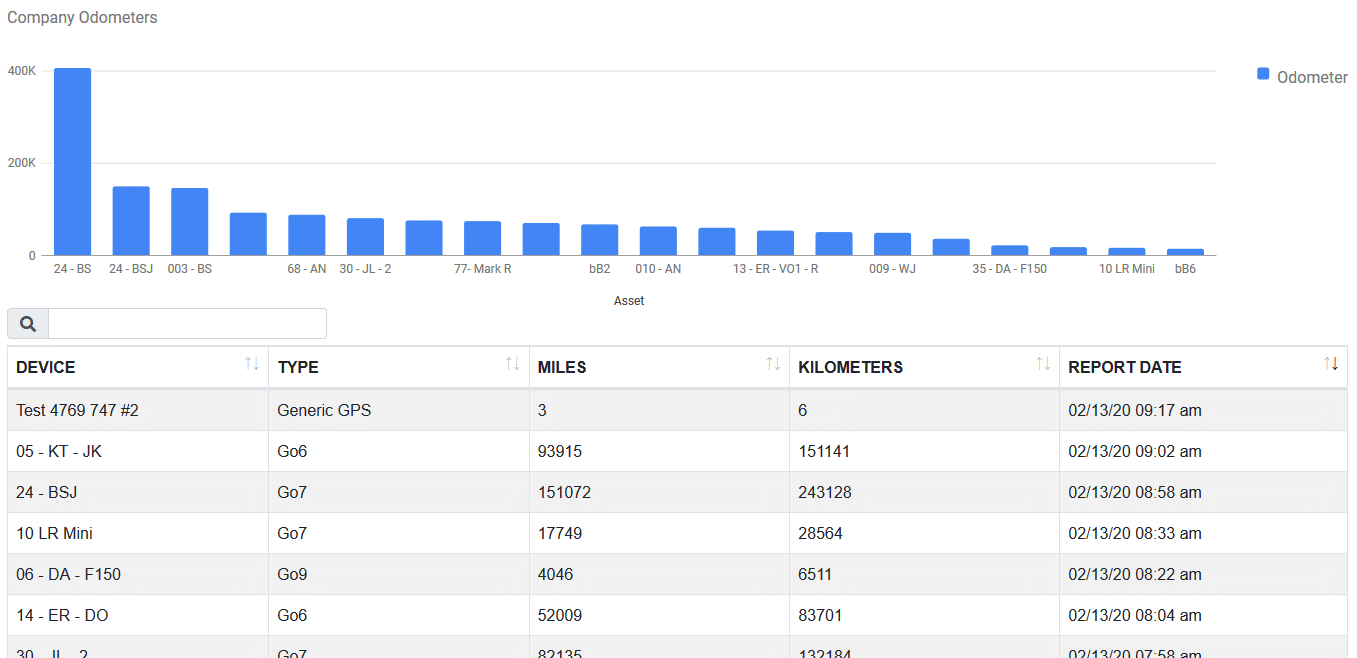
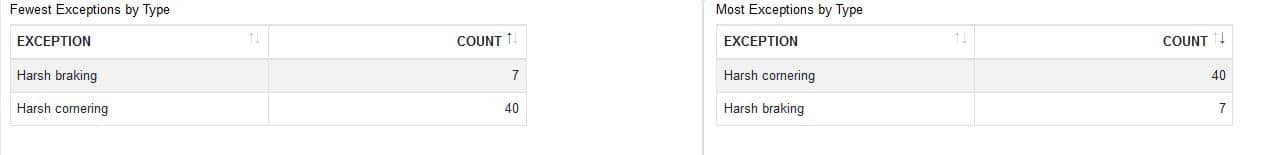
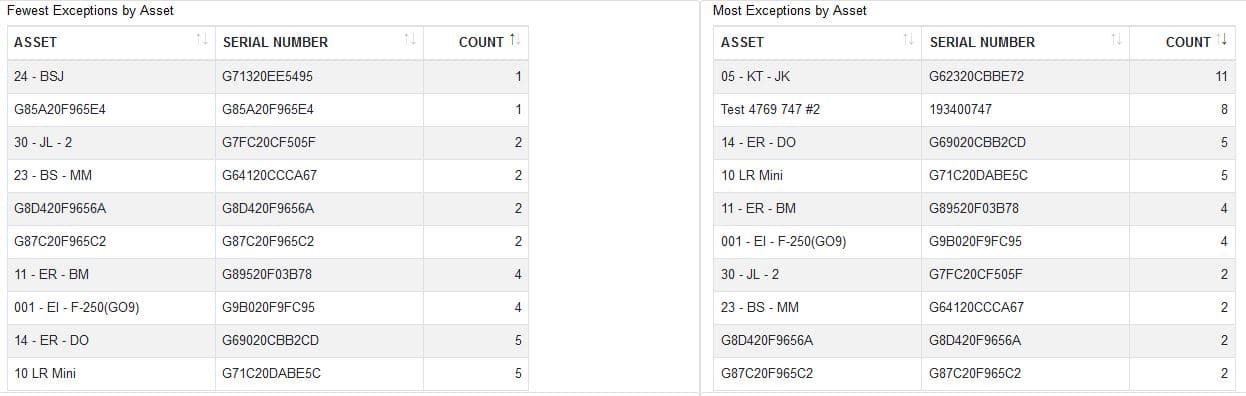
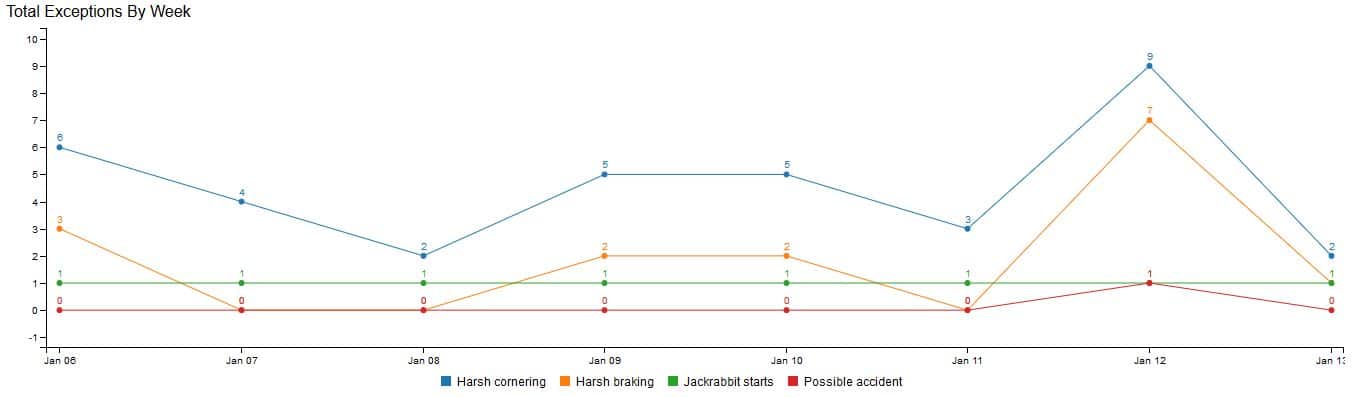
Underwriters can now consider factors that formerly were not available. Total miles driven, time of day, geographic location, and road type all speak to driving conditions and insurance liability. Speed, rapid acceleration, hard braking, and hard cornering are behaviors known to directly impact accident risk. Obviously actual automobile usage is a more accurate method to assess risk than the actuarial methods in use. Actuarial methods aggregate accident risk based on age, gender, marital status, credit score, and driving history. Consequently UBI is a much fairer way to assign risk and set insurance premiums.

In response, telematics vendors are developing more tools to evaluate at risk driving. For example, the free Verisk Data Exchange add-in was recently introduced to the Geotab Marketplace. It is a platform that allows both customers and their insurers to access the same smart analytics that impact insurance premiums.

Usage Based Insurance App

Telematics is the Key to UBI

Advanced telematics is what makes Usage Based Insurance possible. Over the years, telematics providers and their partners have proven the value of telematics data. The information at our fingertips identifies risky driving behaviors. More important, we can use it to improve and correct them with driver training. In contrast, not acting on the information we have increases liability. But that is easily corrected as shown in the video below. Clearly the benefits that make companies more efficient and competitive outweigh any concerns over increased liability. Usage Based Insurance rates are another potential cost savings to add to that return on investment.

Usage Based Insurance Drives Driver Improvement

Improving driver behavior based on telematics data is easy to automate. Apps like Predictive Coach do all of the heavy lifting. There are also traditional courses like the National Safety Council Defensive Driving Course. A combination of ongoing and individually targeted training raises driver safety awareness and creates a culture of safety. Doing that will more than pay for itself in the long run, not to mention reducing your company liability. Proactive training increases the opportunity to reduce insurance premiums with new and innovative insurance plans like Usage Based Insurance. Ultimately the incentive to improve driving behavior for lower insurance rates will drive the success of initiatives like Vision Zero, making the roads safer for us all.

What the Future Holds

In conclusion, Transport Topics recently stated rising insurance premiums are a perennial stress for many motor carriers, many of which are now installing telematics systems with the latest safety technologies to mitigate cost increases. This is a positive trend for the trucking industry, and more carriers should fully embrace these technologies as they soon will become necessary to operate a safe, efficient and, ultimately, more profitable trucking fleet.

We agree and are here to help you get the technology in place, and use it to create positive change.
GEotab GO9 GPS Vehicle Tracking
Fleet Management Platform
Mobile Phone GPS Tracking App
Fleet Weather Service

Social Distance With High Productivity

Social Distance, the New Normal

Businesses should always put any slow time encountered to good use. This is even more important as social distance becomes our temporary reality. Today, restaurants are limited to delivery and pick up. Retail businesses limit the number of people that can be gathered at once. As a result, businesses that serve those sectors can find themselves with some time to invest. What are some things you can do now that will help you come back even stronger when this is all over? It’s a great time to research technologies of interest that you just have not had time or reason to take a serious look at before.

Assessing Current Operations, a Good Place to Start

Did you know that Fleetistics assesses routes? Our Route Optimization Assessment Tool analyzes your routes as they are being driven now, and evaluates the impact that an optimized route of the same stops has. The report considers routes as driven compared to the same order of stops optimized for the shortest distance, and finally, re-ordered for the most efficient order of stops and shortest distance. Ultimately this data is charted to evaluate miles, time, and fuel usage. There is even an interactive chart and map that allows you to dig into the individual route details.

Efficient routing and scheduling is a major difference between companies that just do OK and companies that thrive. Without hard data, many managers just don’t realize how much routes impact profitability. Money is left on the table when routes are left up to the driver or best guessed using brainpower alone. Even more, small changes in a route that may seem insignificant can save significant amounts of fuel and man-hours.

Route Optimization Tool


In the example above for just one vehicle, $24 was saved in one day. Add to that, 30 minutes of labor cost or time to complete another job, and you can see this adds up to some significant dollars even in a small fleet. Call 855-300-0527 to schedule a route optimization assessment for your fleet today!

Expand Work From Home Capabilities

Maintaining social distance is forcing many companies to embrace telecommuting. Working remotely is not a new idea. Many companies are well prepared to leave their offices and telecommute. Sure, there are some challenges, but we are adaptable.

If you are a Windows 10 user working from home, learn to use the task view icon on the taskbar. It is a good substitute for having multiple monitors. If you don’t have windows 10, try holding the windows key and pressing tab to get to task view. It displays all your open windows on one screen so you can navigate between them faster.

Need help getting setup to work remotely? Our IT company, IGTech365 can help you implement Microsoft Office 365 with Teams. Work anywhere, at any time, from a smart phone, laptop or desktop. Being seamlessly mobile is a strategic requirement to be able to always assist your customers.

Implementing Change in the Mobile Workforce

Mobile forms apps quickly generate custom forms. They work hand in hand with your fleet GPS Tracking bringing vehicle location and form data together. These easy to use forms apps are a great tool to remind field workers of all the new steps they must take to stay safe. Also, steps are recorded as completed creating a clear record and chain of custody. Most important, electronic forms are easily modified as safety guidance changes.Electronic Forms Used this way, mobile forms apps assure adherence to social distance protocols and evolving procedures needed to adhere to today’s guidelines. Certainly processes will remain in a state of change, so being able to adapt quickly is critical.

Look for New Opportunity

Certainly there is good news we can focus on. As a business operating a fleet, remember fuel cost is down, delivery and the need for more of it is up, and road traffic is low. What assets and skills do you have available that can be put to work in our new temporary environment? We hear amazing stories of companies re-purposing their products and vehicles to do what is most needed now.

  • Restaurant suppliers shifted to supplying grocery stores when their shelves were empty.
  • Auto makers are building respirators.
  • Clothing companies are producing face masks and gowns.
  • Commercial delivery fleets are assisting in moving emergency supplies to hospitals.

The more we focus on the positives, the stronger we will all come out of this.

GEotab GO9 GPS Vehicle Tracking
Fleet Management Platform
Mobile Phone GPS Tracking App
Fleet Weather Service

GPS Tracking

Fleet Management

Phone Tracking

Tablets & Data

What’s New In MyFleetistics Analytics

Have you clicked on MyFleetistics Analytics lately?

New Safety Dashboard

Fleetistics is always working hard to improve the toolset we provide our clients in the MyFleetistics portal. Going beyond GPS tracking for fleet vehicles, MyFleetistics Analytics brings a variety of tools and views to the data our GPS tracking devices collect. One of our most recent additions is the Safety Dashboard under MyFleetistics Analytics. Driver Safety data is crucial to Fleet Managers. Accessing it quickly in an easy to use format saves you time and money. The Fleetistics Safety Dashboard provides users the most important information without the normal steps required in the GPS system.

Initially, managers can motivate drivers to improve safety by posting this information where drivers congregate in the workplace. Ultimately they can set goals and track the improvement together. We like to say, “Manage by exception and recognize by performance”.
There are several design elements used to make this dashboard pop with “at a glance” information. First, the top row displays the total number of safety exceptions in very large print. Next, there is a breakdown of the 5 performance indicators that are included in that total. Below are charts. First, we display the 5 assets with the fewest safety exceptions (5 safest drivers). Next, a chart shows the 5 assets with the most safety exceptions (5 most at-risk drivers). Finally, there is a graph of total exceptions by week. As a result, you can easily see if both positive and negative trends. One quick look at the dashboard answers three very important questions.

  1. Who gets a pat on the back?
  2. Who needs to have that safety chat?
  3. What driving behaviors should be discussed in reviews and driver meetings?

MyFleetistics Analytics Safety Dashboard

Odometer, Exceptions, Device Status With One Click

MyFleetistics Analytics reports are designed to filter through the data and display what you need to know in a clean and simple visual format. Additionally, reports are searchable and sortable to help you easily identify the issues you need to look into. Your GPS tracking system then provides the reports and tracking details needed to support the conclusions you come to and the decisions you make.

Odometer Analytics

Simple odometer analytics help Fleet Managers to ensure vehicles are not underused or overused. Odometer readings are part of the data you will find in many fleet GPS tracking system reports, but it becomes more usable when isolated in a more meaningful format. The odometer graph makes it easy to see which vehicles are accumulating miles much faster than others. As a result, it is easy to identify where transferring the workload to other vehicles would be beneficial. Who wants to run out a new vehicle warranty faster than necessary? Likewise, it can expose vehicles that may be making unauthorized trips.

Exceptions

Above we looked at total exceptions on the safety dashboard. The exceptions dashboard drills deeper into the details that show which driver or vehicle is generating what exceptions. Managing individual driver behavior with training and incentives for improvement pays off. Even more, identifying and discussing weak areas increases safety awareness and lowers risk.

If you would like assistance accessing the many features in MyFleetistics, visit our training resources page or call us at 855.300.0527.

Globalstar Data Processing Services

Globalstar – The Company

Globalstar data from GPS and other devices is harvested and transmitted by their network of LEO (low earth orbit) satellites. This network provides coverage for 80% of the earth’s surface. They are the premier low-cost satellite communications provider for our industry. When cellular services simply do not provide enough coverage and two-way communication is not needed, Globalstar is the recognized cost-effective leader.

The Globalstar vision statement clearly communicates that connectivity is one of the great commodities in people’s lives today and they are committed to sustainment of the most reliable communication services.


Raw Globalstar Data Processing for Custom Solutions

Fleet managers face significant programming challenges and expense when planning to implement Globalstar data. First of all, developers must decode the data from the device. The data from Globalstar devices is delivered in a complex code string. Each number in the code string means something, similar to a VIN code on a vehicle.


Auto Zone VIN breakdown


In contrast, Globalstar code strings are not straightforward like a VIN. The code string must be translated into a usable format before being processed. Only then can you direct the data to the correct destination and insert it into a database. This requires infrastructure and extensive development.

Fortunately, Fleetistics offers a service that covers these steps. The processed data is provided to clients via API. Clients use the API to insert the data into their database, and it is available for use as needed by the customer.

The Fleetistics data service enables customers to implement Globalstar technology significantly faster, and moves the maintenance of the APIs and processing service to Fleetistics. As new Globalstar devices, protocols and services are updated, Fleetistics updates the web service to support all Fleetistics customers.


Small and Medium Size Business Challenges


AT-5500C Asset Tracker

This technology is readily available for use, but Globalstar products provide raw data. They do not provide a one size fits all user interface that allows you to consume Globalstar data and integrate it into your daily business operations.

Fleetistics has the back end for Globalstar data products in place and ready for you to use. GPS location reporting is integrated into the MyFleetistics portal, complete with monitoring and event alerts for your mobile assets almost anywhere. You can have all the advantages without taking on a costly and complicated development project.


Integrated Solutions

MyFleetistics existing Asset Tracker integration provides a user-friendly interface to view Globalstar tracking updates. We also provide a variety of premium services in addition to standard GPS asset tracking. After hours Priority Notification Service, Globalstar data displayed on road, satellite, or weather maps, and forecast weather overlays are just a few of the choices. We also have a device health view connected to our tech-support services that allows you to quickly identify devices displaying low battery voltage, and devices that have not reported.

Fleetistics turns that raw Globalstar data into valuable and easily consumable business intelligence, without the hassle of developing in house. Call us today for a live demo or to discuss your custom integration needs.

Integrations that Drive ROI

There are two primary ways to integrate GPS Tracking data to drive ongoing return on investment. The first, and most often used is analytical integration. Second, and often overlooked is visual integration. Let’s take a look at both.

Analytical Integrations

Application programming interfaces (APIs), allow you to compile data from multiple sources. An API is provided by many GPS vendors. Some vendors add additional fees for their API service and others do not. Likewise, some providers place limits on what data you may access and how frequently you can make requests. In contrast, others make all collected data available and allow more frequent API calls.

Using the API you can integrate data from your GPS tracking system with data from other applications you use. Combining data and directing it into custom reports brings the information you need to the surface. Additionally, you can format and display the data the way you want to see it. We have one client that developed a custom interface to view his tracking data using the API. He does not use the user interface provided with his system at all.

Integrated exceptions graph

Another great example of analytical integration is the Device Status Table in MyFleetistics. It is integrated with our internal support ticketing. This allows our clients to quickly identify vehicles that have not reported. Additional data indicates if the device is powered. It only takes one click to open a support ticket, and it is all viewed on a single screen.

Device Status Integration

The Value Proposition

The API allows you to use the data collected by your tracking system in other applications. Location, speed, and duration details add additional value when combined with data from other sources. Some common examples are listed below.

  • Planned vs actual routes
  • Identifying customers that have not been visited recently
  • Isolate stops that were too short or too long based on an associated work order
  • Understanding on-time vs early or late stops to improve customer service.

Engine status data and faults directed to your vehicle maintenance software ensures all faults are reported. Unsafe driving events reported directly to the applications used by your Safety and HR Departments saves time over entering events manually. More importantly, it ensures safety records are complete and up to date.

You can also use the API to automate tasks. For instance, when a new customer or vendor order is entered, a custom developed application can automate the dispatch by sending a text message through the integrated application. Other examples are syncing customer locations with the closest vehicle when dispatching and assigning training to a driver that has too many unsafe driving events.

Visual Integrations

Visual integrations allow us to consume more information faster. A quick look at a “heat map” of customer stops speaks volumes. It will quickly reveal a territory that needs another driver assigned as well as an area that has too much staff already committed. Put that side by side with a “heat map” of profit dollars generated and you get a deeper understanding of where it is most valuable for drivers to be.

GIS overlays allow you to see infrastructure in relation to the location of your assets. For a Fire Department, the location of fire hydrants in relation to trucks on the map is very helpful information. Likewise, for an oil well service company, well locations on the tracking map allow dispatch to easily see available assets relative to service locations.

Visual Integration Improved Using a Shapefile Import Tool

For Geotab users, the GIS Shapefile Import Tool allows you to import zones from GIS shapefiles. This creates a zone with the exact perimeter you see in a GIS map overlay. As a functioning zone in Geotab, you can create exception rules for events related to the zone. Examples are entering, exiting, driving too fast inside the zone, stopping too long or not long enough in the zone, and much more.

Visual integration using shapefile import tool

Both analytical and visual integrations are beneficial in a variety of ways. The key is understanding what pieces of information you have that when combined reveal something more. Think about all of the times you have asked a question and your manager or supervisor responds “I don’t know.” You may want to start keeping a list of those questions because if you are asking, there must be some value in knowing. Starting with a clear question, the sources of information that can be integrated to reveal the answers are easily identified.