Free webinars have become commonplace in our new normal, but some pack more punch than most. With so many integrated technologies available for managing government fleets, it is hard to single out the ones that offer the highest return on investment. In this free webinar we do just that, show you the technology that addresses some of the biggest issues facing government fleets today.
Finding increasing value in the data you are collecting is a tough job, especially in today’s uncertain economic climate. As health, EMS, and public safety spending increase and tax revenues decrease, Government Fleet Managers are being asked to do more with less, and without sacrificing safety and compliance. Telematics is an amazing tool to analyze your operations, pinpoint strengths and weaknesses, all while ensuring that safety and compliance are maintained at the highest levels.
In this free webinar you will learn about tracking compliance and levels of service for your Public Works fleet, strategies that will help blaze a path forward to your electrification goals and how telematics goes beyond its traditional use as a fleet management tool to optimize smart transportation and Vision Zero initiatives.
Usage Based Insurance, or UBI, is defined by the National Association of Insurance Commissioners as a type of auto insurance that tracks mileage and driving behaviors. They further explain that the basic idea of UBI is that a driver’s behavior is monitored directly while the person drives, allowing insurers to more closely align driving behaviors with premium rates.
How UBI Works
Underwriters can now consider factors that formerly were not available. Total miles driven, time of day, geographic location, and road type all speak to driving conditions and insurance liability. Speed, rapid acceleration, hard braking, and hard cornering are behaviors known to directly impact accident risk. Obviously actual automobile usage is a more accurate method to assess risk than the actuarial methods in use. Actuarial methods aggregate accident risk based on age, gender, marital status, credit score, and driving history. Consequently UBI is a much fairer way to assign risk and set insurance premiums.
In response, telematics vendors are developing more tools to evaluate at risk driving. For example, the free Verisk Data Exchange add-in was recently introduced to the Geotab Marketplace. It is a platform that allows both customers and their insurers to access the same smart analytics that impact insurance premiums.
Telematics is the Key to UBI
Advanced telematics is what makes Usage Based Insurance possible. Over the years, telematics providers and their partners have proven the value of telematics data. The information at our fingertips identifies risky driving behaviors. More important, we can use it to improve and correct them with driver training. In contrast, not acting on the information we have increases liability. But that is easily corrected as shown in the video below. Clearly the benefits that make companies more efficient and competitive outweigh any concerns over increased liability. Usage Based Insurance rates are another potential cost savings to add to that return on investment.
Usage Based Insurance Drives Driver Improvement
Improving driver behavior based on telematics data is easy to automate. Apps like Predictive Coach do all of the heavy lifting. There are also traditional courses like the National Safety Council Defensive Driving Course. A combination of ongoing and individually targeted training raises driver safety awareness and creates a culture of safety. Doing that will more than pay for itself in the long run, not to mention reducing your company liability. Proactive training increases the opportunity to reduce insurance premiums with new and innovative insurance plans like Usage Based Insurance. Ultimately the incentive to improve driving behavior for lower insurance rates will drive the success of initiatives like Vision Zero, making the roads safer for us all.
What the Future Holds
In conclusion, Transport Topics recently stated rising insurance premiums are a perennial stress for many motor carriers, many of which are now installing telematics systems with the latest safety technologies to mitigate cost increases. This is a positive trend for the trucking industry, and more carriers should fully embrace these technologies as they soon will become necessary to operate a safe, efficient and, ultimately, more profitable trucking fleet.
We agree and are here to help you get the technology in place, and use it to create positive change.
Guest Post submitted by Joshua Tohn, STEER Tech, LLC
Return on Investment – Automate Repetitive Tasks
Return on investment begins with innovation. What are humans good at? Problem solving, communicating complex issues, critical analysis, and creativity. We hire people to do hard work efficiently. The better job they do, the greater the impact on the business. So why do personnel spend so much time doing mundane and repetitive tasks? Sure they can do them, but that’s not where employees are the most valuable.
Fleet management is always looking to optimize fleet operations without compromising the safety of the team or the equipment. Tasks like juggling vehicles in a parking lot or getting them refueled are important to any fleet, but are a waste of human talent. With that in mind, it raises the biggest question of them all: If it’s a waste to have humans do these mundane tasks, then who (or what) should do them?
Introducing STEER Tech
Whether we like it or not, automation is becoming a core aspect of our world, fleet operations. Factories are installing more and more robots if they aren’t already mostly automated. Companies are on a sprint to automate as many different tasks as possible. Often little consideration is given the humans that are diminished by the new equipment. As this wave of automation sweeps over the world, we need to ask ourselves, what is our relationship to robots? Are they an attempt to replace us? Better yet, can we design autonomous equipment to be an extension of human talent? Ideally, automation should increase the return on investment in our human resources.
STEER Tech has found and leveraged the middle ground between the use of automation and the retention of valuable employees. Robots shouldn’t be designed to replace humans, but support them. Many relatively simple tasks like cleaning, parking, and transporting vehicles are necessary to the operation of fleets. At the same time, they are a waste of human talent. With the input of autonomous vehicles, fleet operators can focus on the critical work actually tied to the job.
Autonomous Parking
STEER Tech creates autonomous parking kits that are retrofitted onto existing fleet vehicles. The science is innovative, but the result is simple. When a vehicle using a STEER Kit arrives at a parking lot, the driver just gets out and goes right to work. The vehicle safely navigates to an available spot and parks itself. The kit doesn’t impact the vehicle’s usability at all, it is just a couple of low profile sensors and a small computer that can be installed in less than a day.
Autonomous parking is useful for consumers, but the use cases expand dramatically when applied to fleet operations. A single operator can remotely move self-driving vehicles around a parking lot, send them to garages, have the vehicles meet drivers at the door, and report back a variety of diagnostics information, such as fuel levels and vehicle health.
The STEER Kit is an extension of the employees, saving them the wasted time walking around parking lots, finding the right car with the right keys, reducing the risk of collisions and damage to the vehicles, and most importantly, turning every vehicle in a parking lot into the most vigilant and alert driver. With over 50,000 crashes in U.S. parking lots per year, having the safety net of an autonomous car will provide return on investment simply by avoiding accidental damage.
The Dollar Value of Efficiency
In the same way your GPS tracking system pays off big by helping you to reduce idle events and aggressive driving habits, savings are found when the cost of brief but frequent wasteful events add up over time. It only takes a couple of minutes to park a car, right? How much does that really cost?
First, assume approximately 260 workdays in a year. If one employee spends ten minutes retrieving the vehicle, and ten minutes parking the vehicle every day, you end up with 86 hours a year spent just parking and retrieving vehicles. Next, assume an 8-hour shift, that would add up to over 10 working days lost a year. That could easily cost the company over $1,500 per employee per year depending on salary and benefits. How many more job sites could someone visit in 10 days? How many more deliveries can be made? That is where we find substantial return on investment.
Finally take those 86 hours (or 10 working days) and multiply them by how many employees are parking and retrieving those fleet vehicles. 10 people = 860 hours. It’s easy to overlook how expensive the time spent parking cars is. Ultimately spending what could be productive hours on parking is just money thrown away. Parking a car does nothing to generate the company revenue. Certainly it doesn’t save money. On the other hand, autonomous vehicles, applied in the right way, recoup the loss without putting employment opportunities in jeopardy.
The Future of Fleet Management
The world is headed toward a future of near-universal automation. We need to ask ourselves: What will our relationship with automation be? With technology like the STEER Kit, the answer is a harmonious future. Tools like this are not a far-off Jetson’s style future and they are available now. Integrating them as powerful extensions of the employee contributes to making a company more successful. Employees have more time to focus their skills and knowledge on the real work, supporting the team with every step.
The future of fleet management is one of automation. Imagine a team member steps out of the office and the vehicle they need for the day is there waiting for them. One operator can summon and send the right vehicles to the right places when they are needed. Done safely, done right, and with no hassle or delay.
Measuring fleet productivity and controlling idle waste are two easy ways to save money in difficult times.
Contributed by Sherri Mills
In this blog, we discuss two top cost-control strategies using Geotab GO device data to help boost productivity and vehicle uptime. In the business we often refer to this as the “low hanging fruit”.
What is fleet productivity?
Tracking fleet productivity is a top concern for many businesses, especially when labor is one of their most significant costs. Improving productivity will help you provide optimal service to your customers, which is important now more than ever. Telematics technology gives fleet managers accurate and detailed visibility over their vehicles, helping businesses allocate assets where they are needed most.
Maintaining 100% visibility over vehicle utilization and work assignments helps make sure that Hours Paid = Hours Worked as much as possible. Gaining just one hour of driver productivity per day, or even per week, adds up quickly.
Keeping Score
Fleet productivity is the basic measure of employee work output. Creating a productivity score provides a way to objectively measure performance so you can identify successes and pinpoint where improvement is needed.
Keep in mind, it is not ideal to expect 100% productivity, especially when employees lack control over their own output, for example when they are dependent upon customer availability, or when they are impacted by adverse weather and traffic.
Productivity score formula
(Total Hours Worked) / (Shift Hours less Lunch, Breaks or Meetings, Downtime like traffic) = Productivity Score
For example: (Drive time = 5 hours + Office time = 1 hour) / (8 hour shift – 1 hour lunch and breaks)
(5+1) / (8-1) = 86% Productivity score
You can adjust this formula as needed depending on the structure of your business.
Managing Idling
If you’re looking at ways to improve productivity, idling is another area to look at. While not all idling is avoidable, for example in heavy traffic, there are many instances where it can and should be minimized.
Excessive idling not only wastes fuel, but also time idling vehicles are not making deliveries or driving to their next work location. Idling can also put extra load and engine hours on your fleet, increasing the number of oil changes and other maintenance tasks required.
While the GO device automatically monitors idling within each trip (no setup required), customizable reports and rules make tracking idling easy.
Here are the most effective reports for identifying and curbing idling:
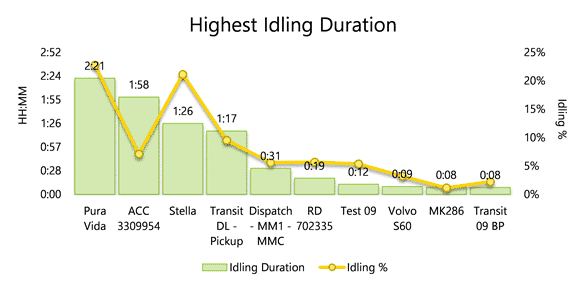
1. Highest Idling Duration
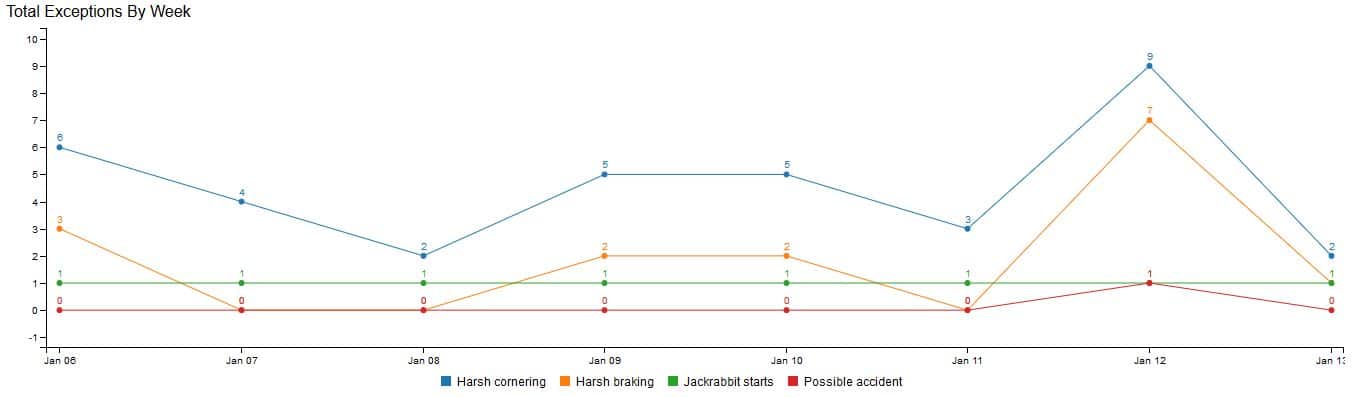
See the percentages of engine time spent idling versus driving, per driver, per day. The results of this report can be used to determine which drivers need further training.
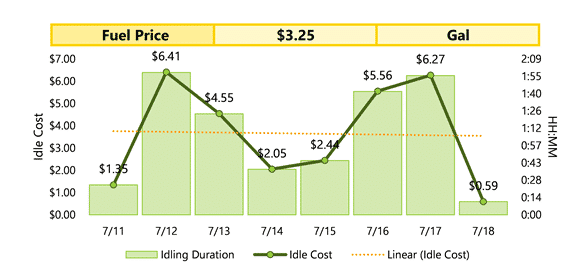
2. Daily Idling Cost Trend
The Daily Idling Cost Trend report provides a rolling, seven-day view of your fleet’s total cost of idling, which can be refreshed daily. You can use this report to spot trends during certain days of the week, which may correlate to specific work assignments or job sites, allowing you to make adjustments for the following week.
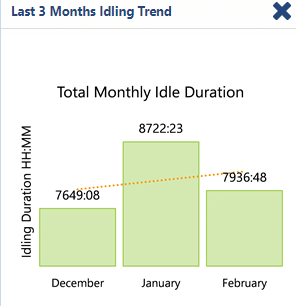
3. Last 3 Months Idling Trends Report
This report displays the total fuel spent while idling across the entire fleet. You can use this report to assess whether or not your efforts to reduce idling have been successful. Trend reporting tools can also be used in areas like asset utilization.
You can download the Last 3 Months Idling Trend from the Geotab Marketplace. View report.
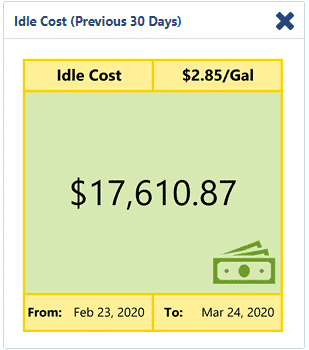
4. Idle Cost (previous 30 days)
The Idle Cost report provides a 30-day rolling view of the fleet’s total cost of Idling. While managing productivity is key, seeing the whole cost of idling over 30 days is impactful as well.
Conclusion
Telematics systems can be used to measure and understand the productivity of fleets. With Fleetistics and the Geotab telematics platform, you and your customers are assured exceptional data producing real ROI results.
We look forward to partnering with you and demonstrating real success for your customers’ fleets in 2020. The best is yet to come.
There are two primary ways to integrate GPS Tracking data to drive ongoing return on investment. The first, and most often used is analytical integration. Second, and often overlooked is visual integration. Let’s take a look at both.
Analytical Integrations
Application programming interfaces (APIs), allow you to compile data from multiple sources. An API is provided by many GPS vendors. Some vendors add additional fees for their API service and others do not. Likewise, some providers place limits on what data you may access and how frequently you can make requests. In contrast, others make all collected data available and allow more frequent API calls.
Using the API you can integrate data from your GPS tracking system with data from other applications you use. Combining data and directing it into custom reports brings the information you need to the surface. Additionally, you can format and display the data the way you want to see it. We have one client that developed a custom interface to view his tracking data using the API. He does not use the user interface provided with his system at all.
Another great example of analytical integration is the Device Status Table in MyFleetistics. It is integrated with our internal support ticketing. This allows our clients to quickly identify vehicles that have not reported. Additional data indicates if the device is powered. It only takes one click to open a support ticket, and it is all viewed on a single screen.
The Value Proposition
The API allows you to use the data collected by your tracking system in other applications. Location, speed, and duration details add additional value when combined with data from other sources. Some common examples are listed below.
Planned vs actual routes
Identifying customers that have not been visited recently
Isolate stops that were too short or too long based on an associated work order
Understanding on-time vs early or late stops to improve customer service.
Engine status data and faults directed to your vehicle maintenance software ensures all faults are reported. Unsafe driving events reported directly to the applications used by your Safety and HR Departments saves time over entering events manually. More importantly, it ensures safety records are complete and up to date.
You can also use the API to automate tasks. For instance, when a new customer or vendor order is entered, a custom developed application can automate the dispatch by sending a text message through the integrated application. Other examples are syncing customer locations with the closest vehicle when dispatching and assigning training to a driver that has too many unsafe driving events.
Visual Integrations
Visual integrations allow us to consume more information faster. A quick look at a “heat map” of customer stops speaks volumes. It will quickly reveal a territory that needs another driver assigned as well as an area that has too much staff already committed. Put that side by side with a “heat map” of profit dollars generated and you get a deeper understanding of where it is most valuable for drivers to be.
GIS overlays allow you to see infrastructure in relation to the location of your assets. For a Fire Department, the location of fire hydrants in relation to trucks on the map is very helpful information. Likewise, for an oil well service company, well locations on the tracking map allow dispatch to easily see available assets relative to service locations.
Visual Integration Improved Using a Shapefile Import Tool
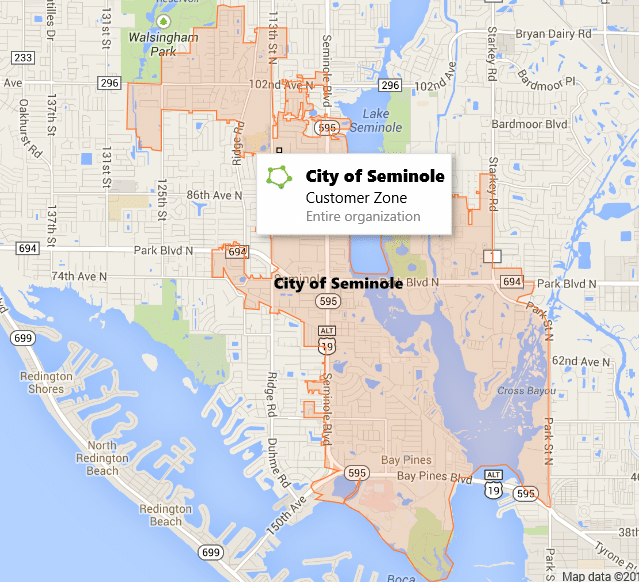
For Geotab users, the GIS Shapefile Import Tool allows you to import zones from GIS shapefiles. This creates a zone with the exact perimeter you see in a GIS map overlay. As a functioning zone in Geotab, you can create exception rules for events related to the zone. Examples are entering, exiting, driving too fast inside the zone, stopping too long or not long enough in the zone, and much more.
Both analytical and visual integrations are beneficial in a variety of ways. The key is understanding what pieces of information you have that when combined reveal something more. Think about all of the times you have asked a question and your manager or supervisor responds “I don’t know.” You may want to start keeping a list of those questions because if you are asking, there must be some value in knowing. Starting with a clear question, the sources of information that can be integrated to reveal the answers are easily identified.