There are two primary ways to integrate GPS Tracking data to drive ongoing return on investment. The first, and most often used is analytical integration. Second, and often overlooked is visual integration. Let’s take a look at both.
Analytical Integrations
Application programming interfaces (APIs), allow you to compile data from multiple sources. An API is provided by many GPS vendors. Some vendors add additional fees for their API service and others do not. Likewise, some providers place limits on what data you may access and how frequently you can make requests. In contrast, others make all collected data available and allow more frequent API calls.
Using the API you can integrate data from your GPS tracking system with data from other applications you use. Combining data and directing it into custom reports brings the information you need to the surface. Additionally, you can format and display the data the way you want to see it. We have one client that developed a custom interface to view his tracking data using the API. He does not use the user interface provided with his system at all.
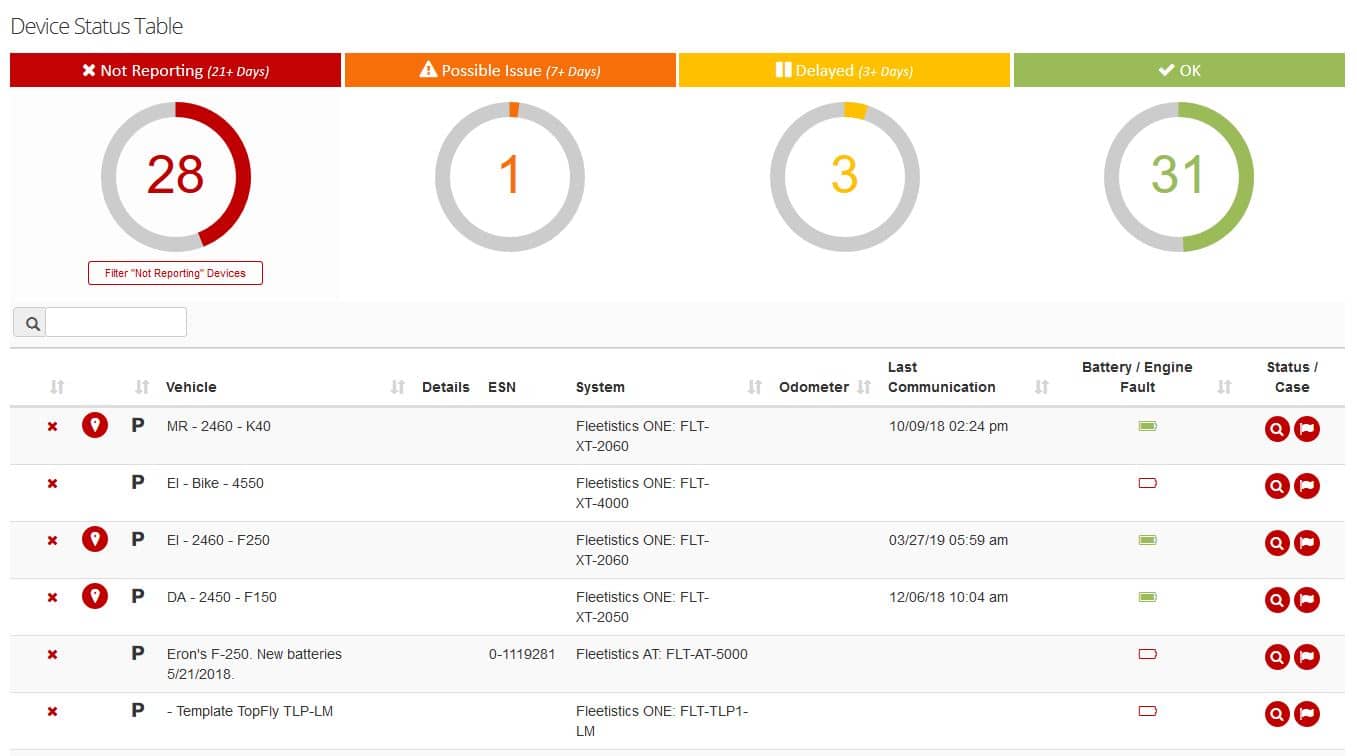
Another great example of analytical integration is the Device Status Table in MyFleetistics. It is integrated with our internal support ticketing. This allows our clients to quickly identify vehicles that have not reported. Additional data indicates if the device is powered. It only takes one click to open a support ticket, and it is all viewed on a single screen.
The Value Proposition
The API allows you to use the data collected by your tracking system in other applications. Location, speed, and duration details add additional value when combined with data from other sources. Some common examples are listed below.
- Planned vs actual routes
- Identifying customers that have not been visited recently
- Isolate stops that were too short or too long based on an associated work order
- Understanding on-time vs early or late stops to improve customer service.
Engine status data and faults directed to your vehicle maintenance software ensures all faults are reported. Unsafe driving events reported directly to the applications used by your Safety and HR Departments saves time over entering events manually. More importantly, it ensures safety records are complete and up to date.
You can also use the API to automate tasks. For instance, when a new customer or vendor order is entered, a custom developed application can automate the dispatch by sending a text message through the integrated application. Other examples are syncing customer locations with the closest vehicle when dispatching and assigning training to a driver that has too many unsafe driving events.
Visual Integrations
Visual integrations allow us to consume more information faster. A quick look at a “heat map” of customer stops speaks volumes. It will quickly reveal a territory that needs another driver assigned as well as an area that has too much staff already committed. Put that side by side with a “heat map” of profit dollars generated and you get a deeper understanding of where it is most valuable for drivers to be.
GIS overlays allow you to see infrastructure in relation to the location of your assets. For a Fire Department, the location of fire hydrants in relation to trucks on the map is very helpful information. Likewise, for an oil well service company, well locations on the tracking map allow dispatch to easily see available assets relative to service locations.
Visual Integration Improved Using a Shapefile Import Tool
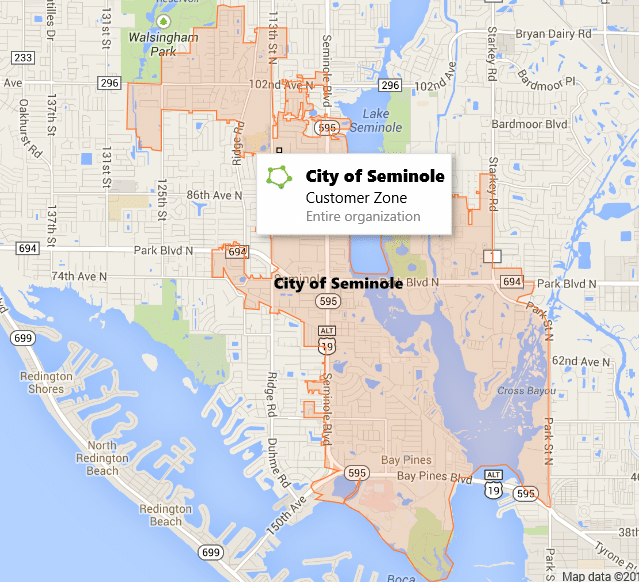
For Geotab users, the GIS Shapefile Import Tool allows you to import zones from GIS shapefiles. This creates a zone with the exact perimeter you see in a GIS map overlay. As a functioning zone in Geotab, you can create exception rules for events related to the zone. Examples are entering, exiting, driving too fast inside the zone, stopping too long or not long enough in the zone, and much more.
Both analytical and visual integrations are beneficial in a variety of ways. The key is understanding what pieces of information you have that when combined reveal something more. Think about all of the times you have asked a question and your manager or supervisor responds “I don’t know.” You may want to start keeping a list of those questions because if you are asking, there must be some value in knowing. Starting with a clear question, the sources of information that can be integrated to reveal the answers are easily identified.


